BACKTESTING · IN YOUR OWN WORDS
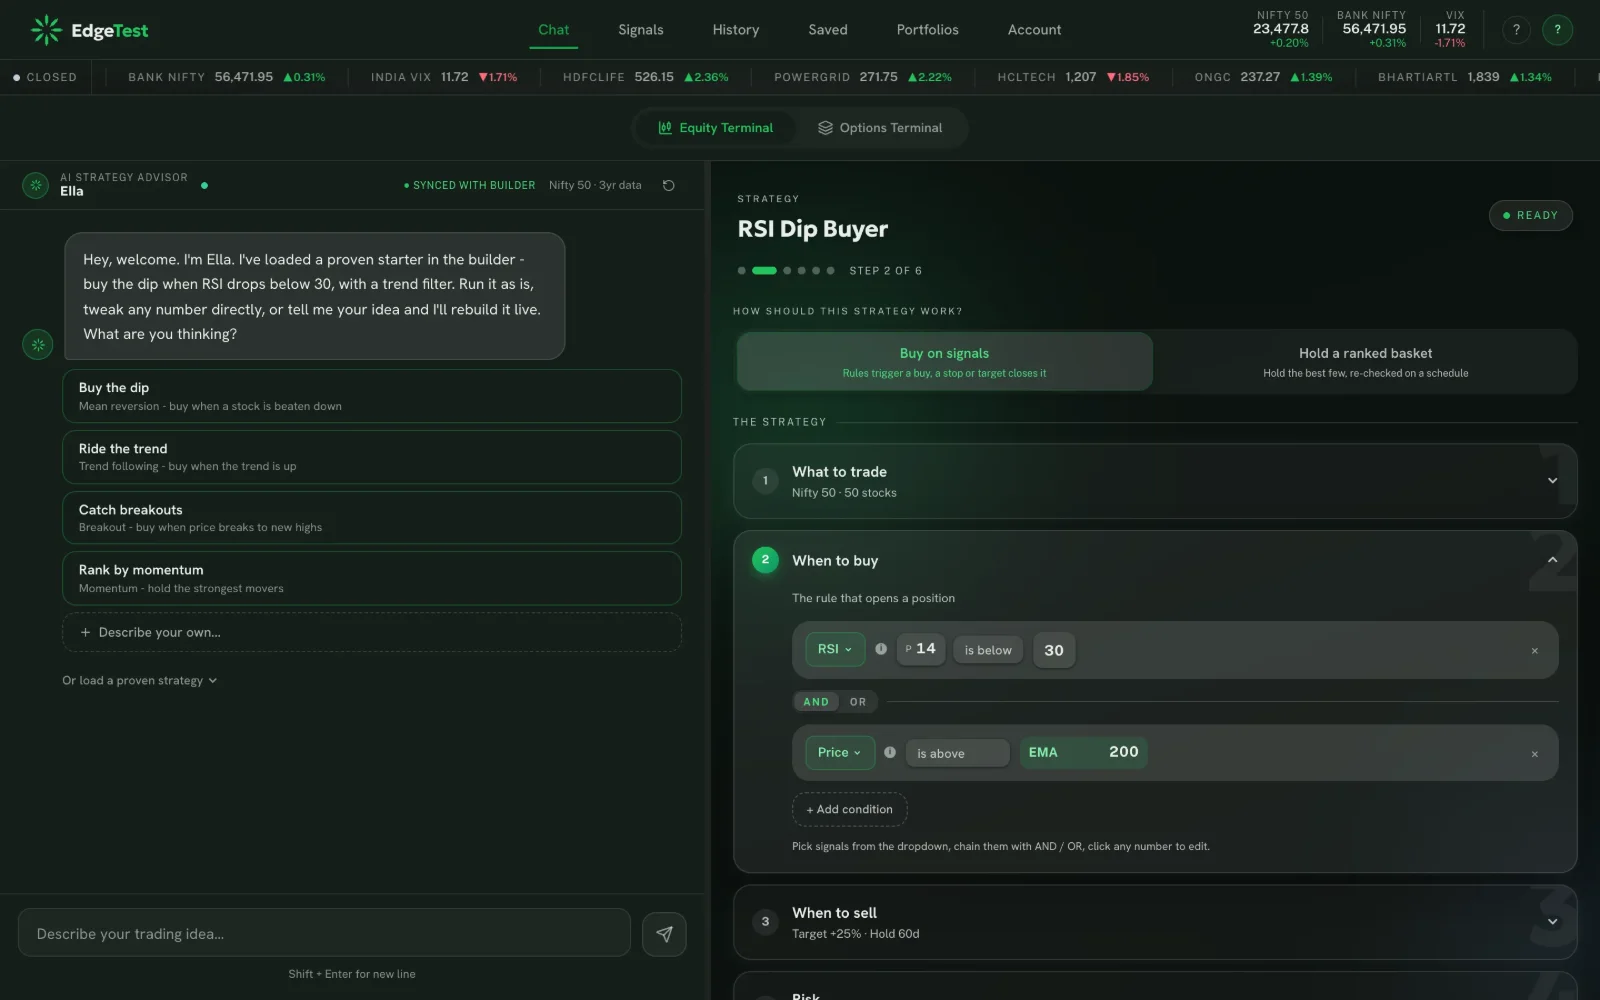
Say it in English.
Test it on ten years of the market.
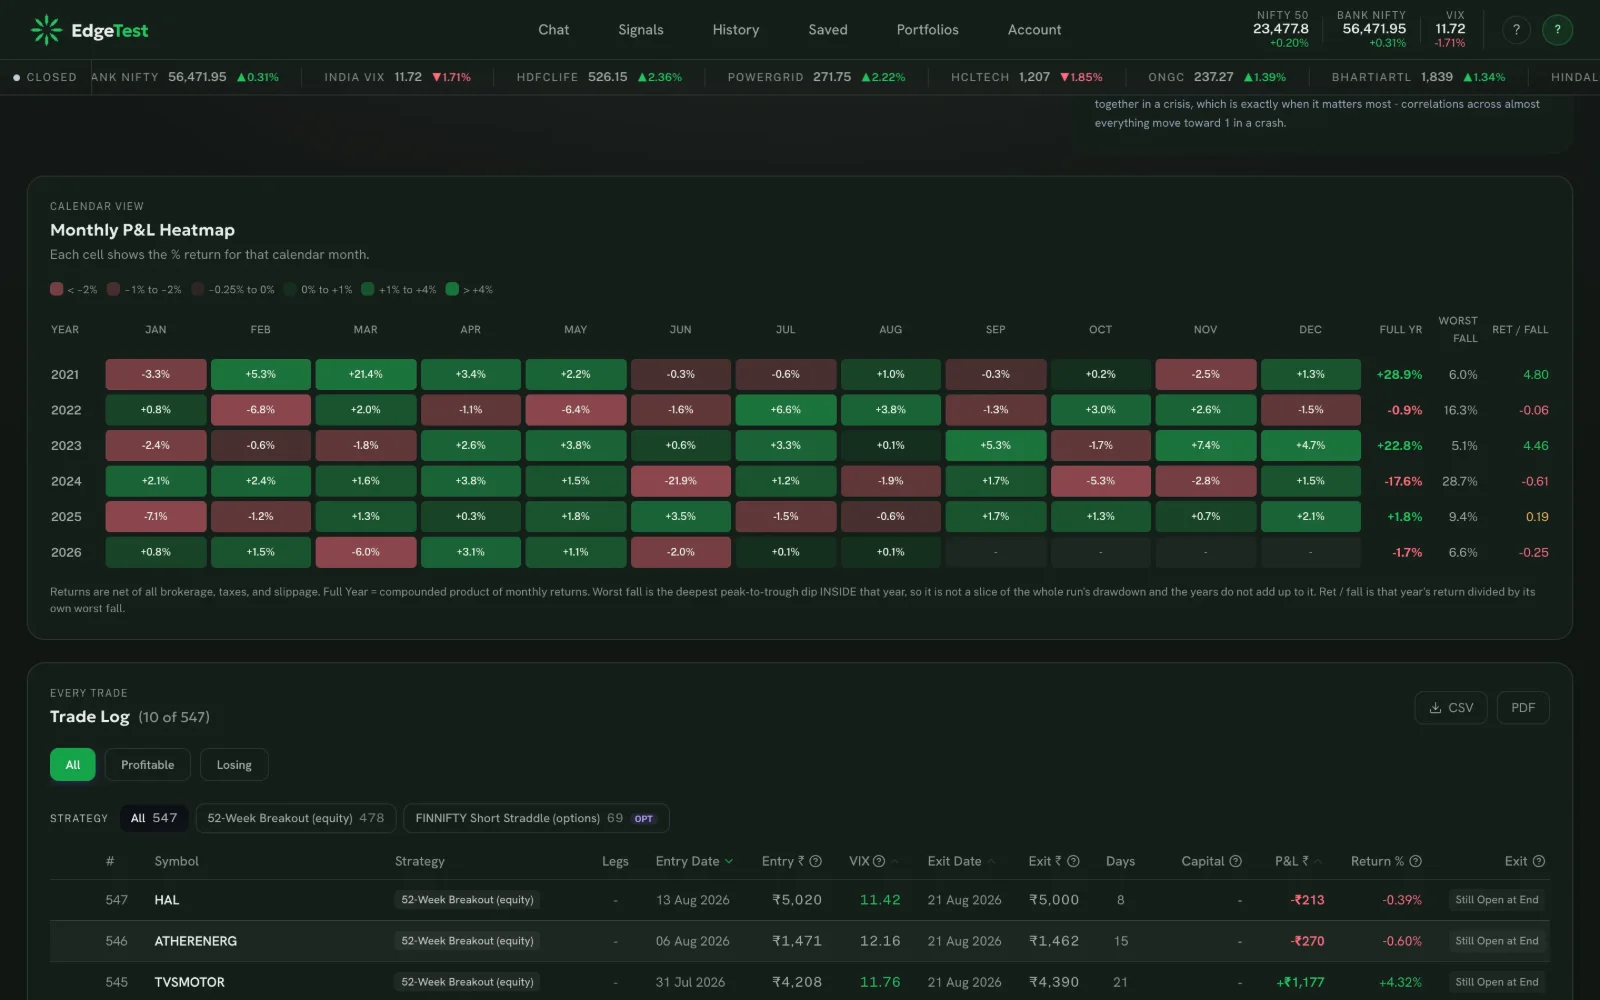
One plain sentence becomes a full backtest across the entire NSE - every charge itemised, every assumption disclosed.
No account needed to read a real report first
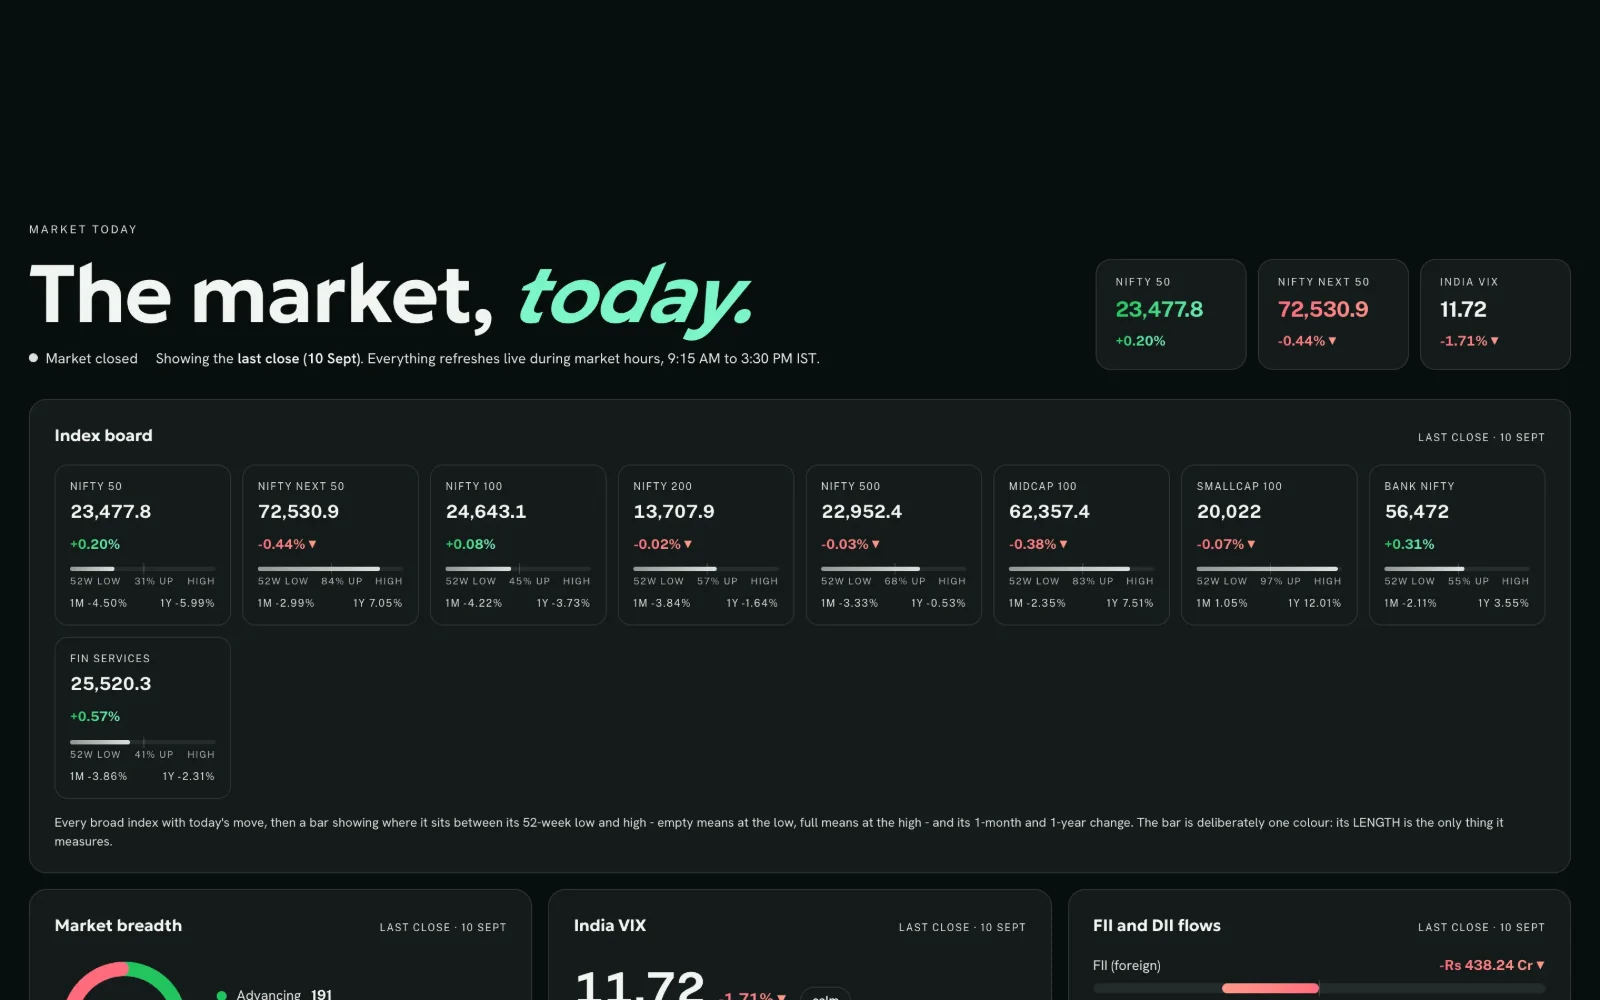
THE EDGE METER · WHAT ACTUALLY HAPPENED TODAY
Written by rule from the day's numbers, never by hand. Not a signal, not advice.
THE MARKET, DRAWN AS ITS HOLES · GAIN ABOVE THE LINE, DEPTH BELOW ITGOLDEN CROSS · NIFTY 500 · ALL WINDOWS END 14 JUL 2026
A backtest is a dive log.
How deep did yours go?
INDEX GAIN SINCE AUG 2016
DEPTH BELOW THE LAST PEAK
0%-20%-40%
SINCE 2024
2018 NBFC
2020 COVID
2022 BEAR
INDEX PATH INSIDE+-2.4%DEEPEST HOLE-12.7%TESTING THE LAST 2 YEARS
TEST LENGTH
2 yrs
484 sessions, ending July 2026
RETURN IT SHOWED
10.65%
a year, after charges
WORST LOSS IT SHOWED
19.5%
peak to trough
TRADES TESTED
46
the evidence you have
CRASHES INCLUDED
0
of the last three
The return and loss above are what this one strategy's test reported on past data for the window shown, after charges. A simulated past result, not a forecast and not a promise of future returns. EdgeTest is not a SEBI-registered adviser and this is not investment advice.
TEST WINDOWLOOPING
Your 3-year test never left the shallows. The loss row above is the part you keep.
SIMULATED ON PAST DATA · NOT A FORECAST
Nothing about the strategy changes between these five runs. Only how far back we let it look. A two year test hands you a strategy whose worst loss looks like nineteen percent; the same rules over ten years lost thirty seven. Most tools in India will only ever show you the first number.
WHY TESTING MATTERS
93%
of individual F&O traders lost money over FY22-24. SEBI's own study, not ours.
₹1.8L Cr
lost by them in those three years. An average of ₹2 lakh each.
96%
of the winning side's profits were made by algorithms - the people who test.
The other side of your trade has already tested it. Backtest before you trade - it is the only edge that is free.
SOURCE: SEBI STUDIES, SEP 2024 AND JUL 2025. SHOWN BECAUSE IT IS TRUE, NOT BECAUSE IT SELLS.